It might be a bit perplexing to look at a cryptocurrency price chart for the first time. The sheer quantity of numbers, lines, and colours might also be initially intimidating—that is why trading tools and indicators exist. These cryptocurrency indicators are essential for both long- and short-term trading, partnered with the method of technical analysis that relies on historical data to create mathematical models of anticipated market behavior.
Traders can make well-informed judgments by collecting data points and calculating probabilities. Meanwhile, the experienced trader can read the market mood in a way that maximizes gains and minimizes losses by employing numerous crypto trading indicators in tandem.
If you are new to crypto trading, it is a good idea to take a breather. Understanding the purpose and essence of trading will aid your success. So, in this article, we will briefly look into what crypto trading indicators are and which are commonly used by many traders. Let us begin by reviewing what crypto trading is.
Table of Contents
What is Crypto Trading?
Cryptocurrency trading is a 24-hour market, unlike traditional stock exchanges, which close at the end of the day. Speculating on price fluctuations or purchasing and selling crypto-assets like Bitcoin and Ethereum via an exchange are both parts of cryptocurrency trading.
Using Technical Analysis in Crypto Trading
Earlier, this method was mentioned. Many crypto traders employ technical analysis to forecast the future of a market based on real-world data. It entails examining historical data on the cryptocurrency in issues, such as volume and movement. It is contrasted to another approach known as fundamental analysis, which is used to determine whether a cryptocurrency is overvalued or undervalued.
Hundreds of patterns and signals have been produced by academics across the business to assist technical analysis trading. Technical analysts have created a variety of trading methods to aid them in forecasting and trading market changes. And these are what we called cryptocurrency trading indicators (also called technical indicators).


What are Cryptocurrency Trading Indicators?
Crypto trading indicators are tools that help you get the most out of your crypto investments. Indicators can assist you in determining an asset’s price trajectory, whether you are a novice or an experienced trader.
A wide range of factors may be measured using trading indicators—price, volume, and momentum, for example. This, like so many other aspects of trading, is a matter of personal preference. Crypto traders have differing opinions on which signals should be relied upon. Some people prefer historical prices to profit, while others prefer profit to historical prices.
Here are the three commonly used indicators in cryptocurrency trading:
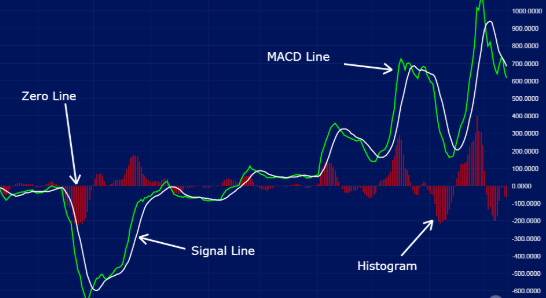
Moving Average Convergence Divergence (MACD)
The Moving Average Convergence Divergence (MACD) is a trend-following indicator that uses moving averages to assess the momentum of a stock, cryptocurrency, or other traded commodity.
When two moving averages converge, they start to move in the same direction. When two moving averages diverge, however, it indicates that they are moving away from one another. Convergences in these moving averages imply a loss of momentum, whilst divergences suggest a gain of momentum. A rise in momentum is typically interpreted as bullish, while a drop is interpreted as negative
Relative Strength Index (RSI)
The RSI indicator aids traders in determining when a cryptocurrency’s price has deviated too far from its “real” value, allowing them to profit before the market corrects. Traders can also find excellent trading entry opportunities by using the RSI.
The indicator, as its name implies, evaluates the “strength” of dynamics and the price trend of a digital asset. As a result, it aids in identifying overbought and oversold circumstances. The RSI ranges from 0 to 100. The 50th percentile divides bearish and bullish circumstances.
On-Balance Volume (OBV)
The OBV is a volume-and-momentum indicator. It may be used to spot instances when the asset’s volume profile does not match the price action.
Its method is simple: if today’s Bitcoin or other currency closing price is greater than yesterday’s, today’s trading volume is added to the prior OBV figure. If today’s closing price is lower than yesterday’s, the prior OBV is removed.
Important note: Please keep in mind that the cryptocurrency market is quite volatile. If you are new to cryptocurrencies, researching before trading or investing in your favorite digital asset is always a smart idea. If you are looking for a user-friendly trading platform, Bitcoin Trader is an excellent place to start. It also accepts a number of popular cryptos like Ethereum, Ripple, Tezos and other cryptocurrencies from anywhere, anytime!
Follow TodayTechnology for more!